Company Summary Report
The report is intended for the company owner and gathers all important metrics on:
- revenue for the entire company and individual locations
- orders
- store
- employees
Report Filters
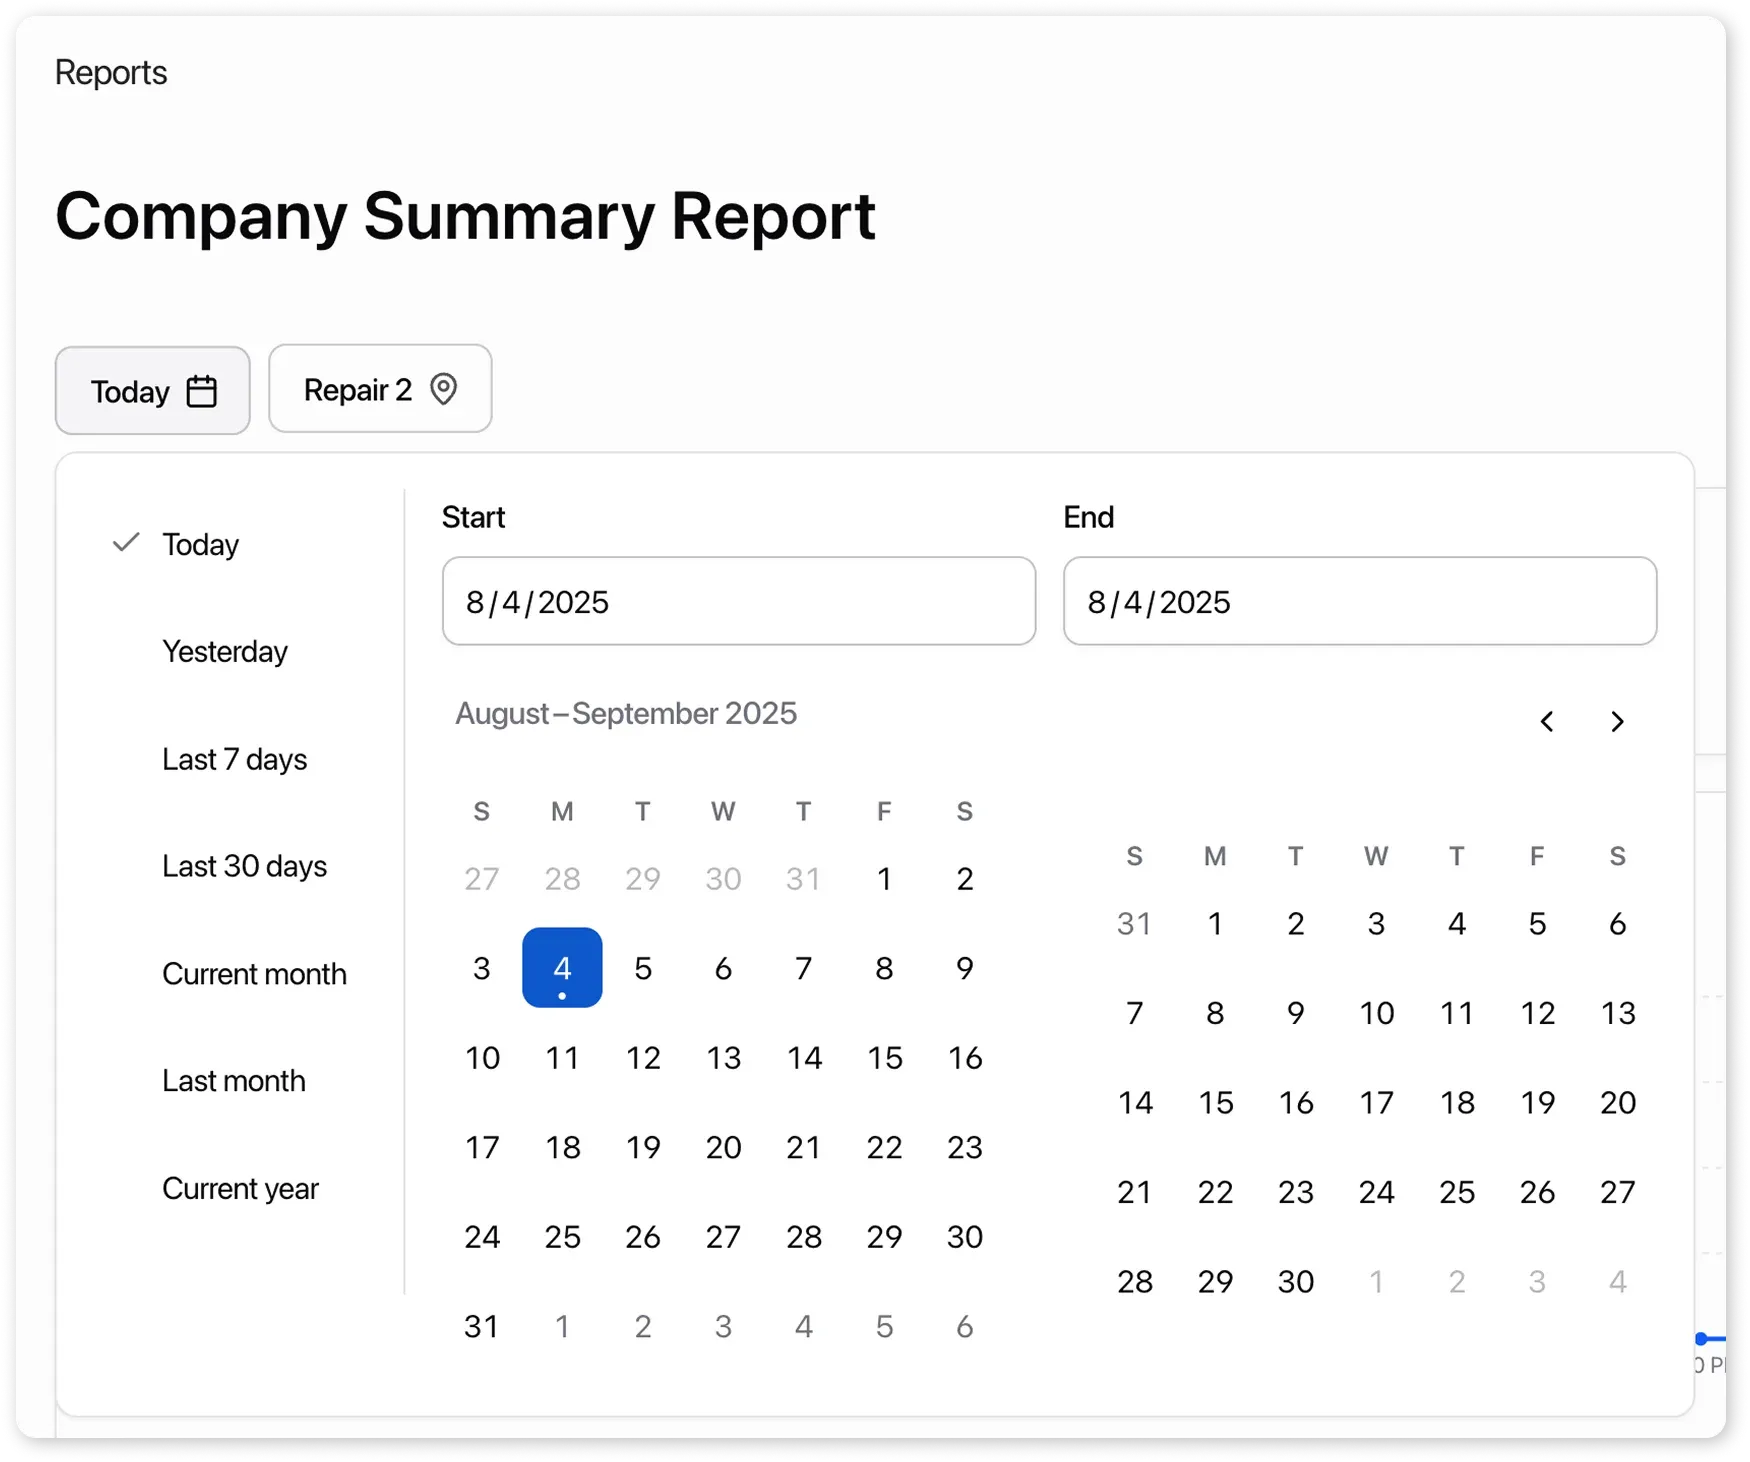
Section titled “Report Filters”Filters available by period:
- Today
- Yesterday
- Last 7 days
- Last 30 days
- Current month
- Previous month
- Year to date
- Ability to manually select the desired period on the calendar.
Also, location filter: you can select all locations or view analytics for a single location.
Report Metrics
Section titled “Report Metrics”General Company Data
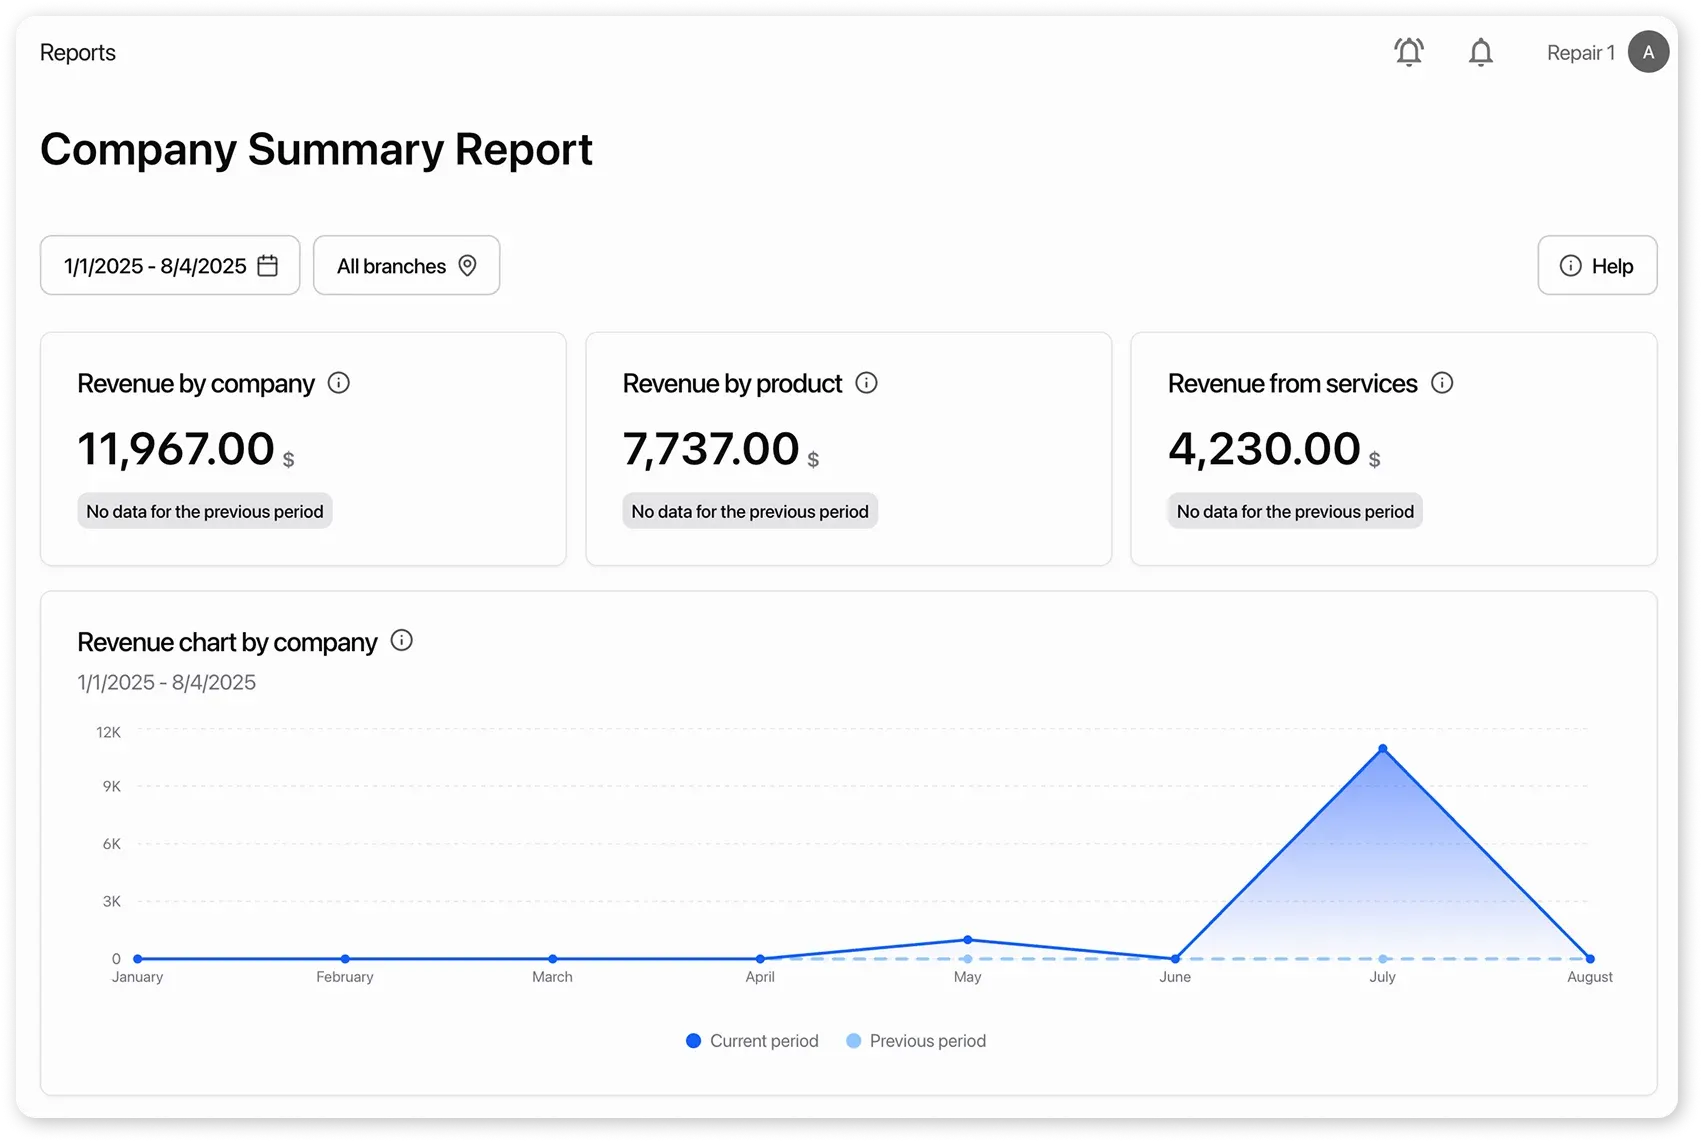
Section titled “General Company Data”All metrics are compared with the previous period and show growth or decline in company performance.
Revenue by company
Section titled “Revenue by company”sum of income from closed paid orders and paid sales, including products and services.
Revenue by product
Section titled “Revenue by product”how much the company earned from product sales for the selected period.
Revenue from services
Section titled “Revenue from services”sum of all provided services from closed and paid orders and sales.
Revenue chart by company
Section titled “Revenue chart by company”shows when and how much revenue the company generated. Helps identify which days or weeks had higher or lower income and compare with the previous period.
Order Data
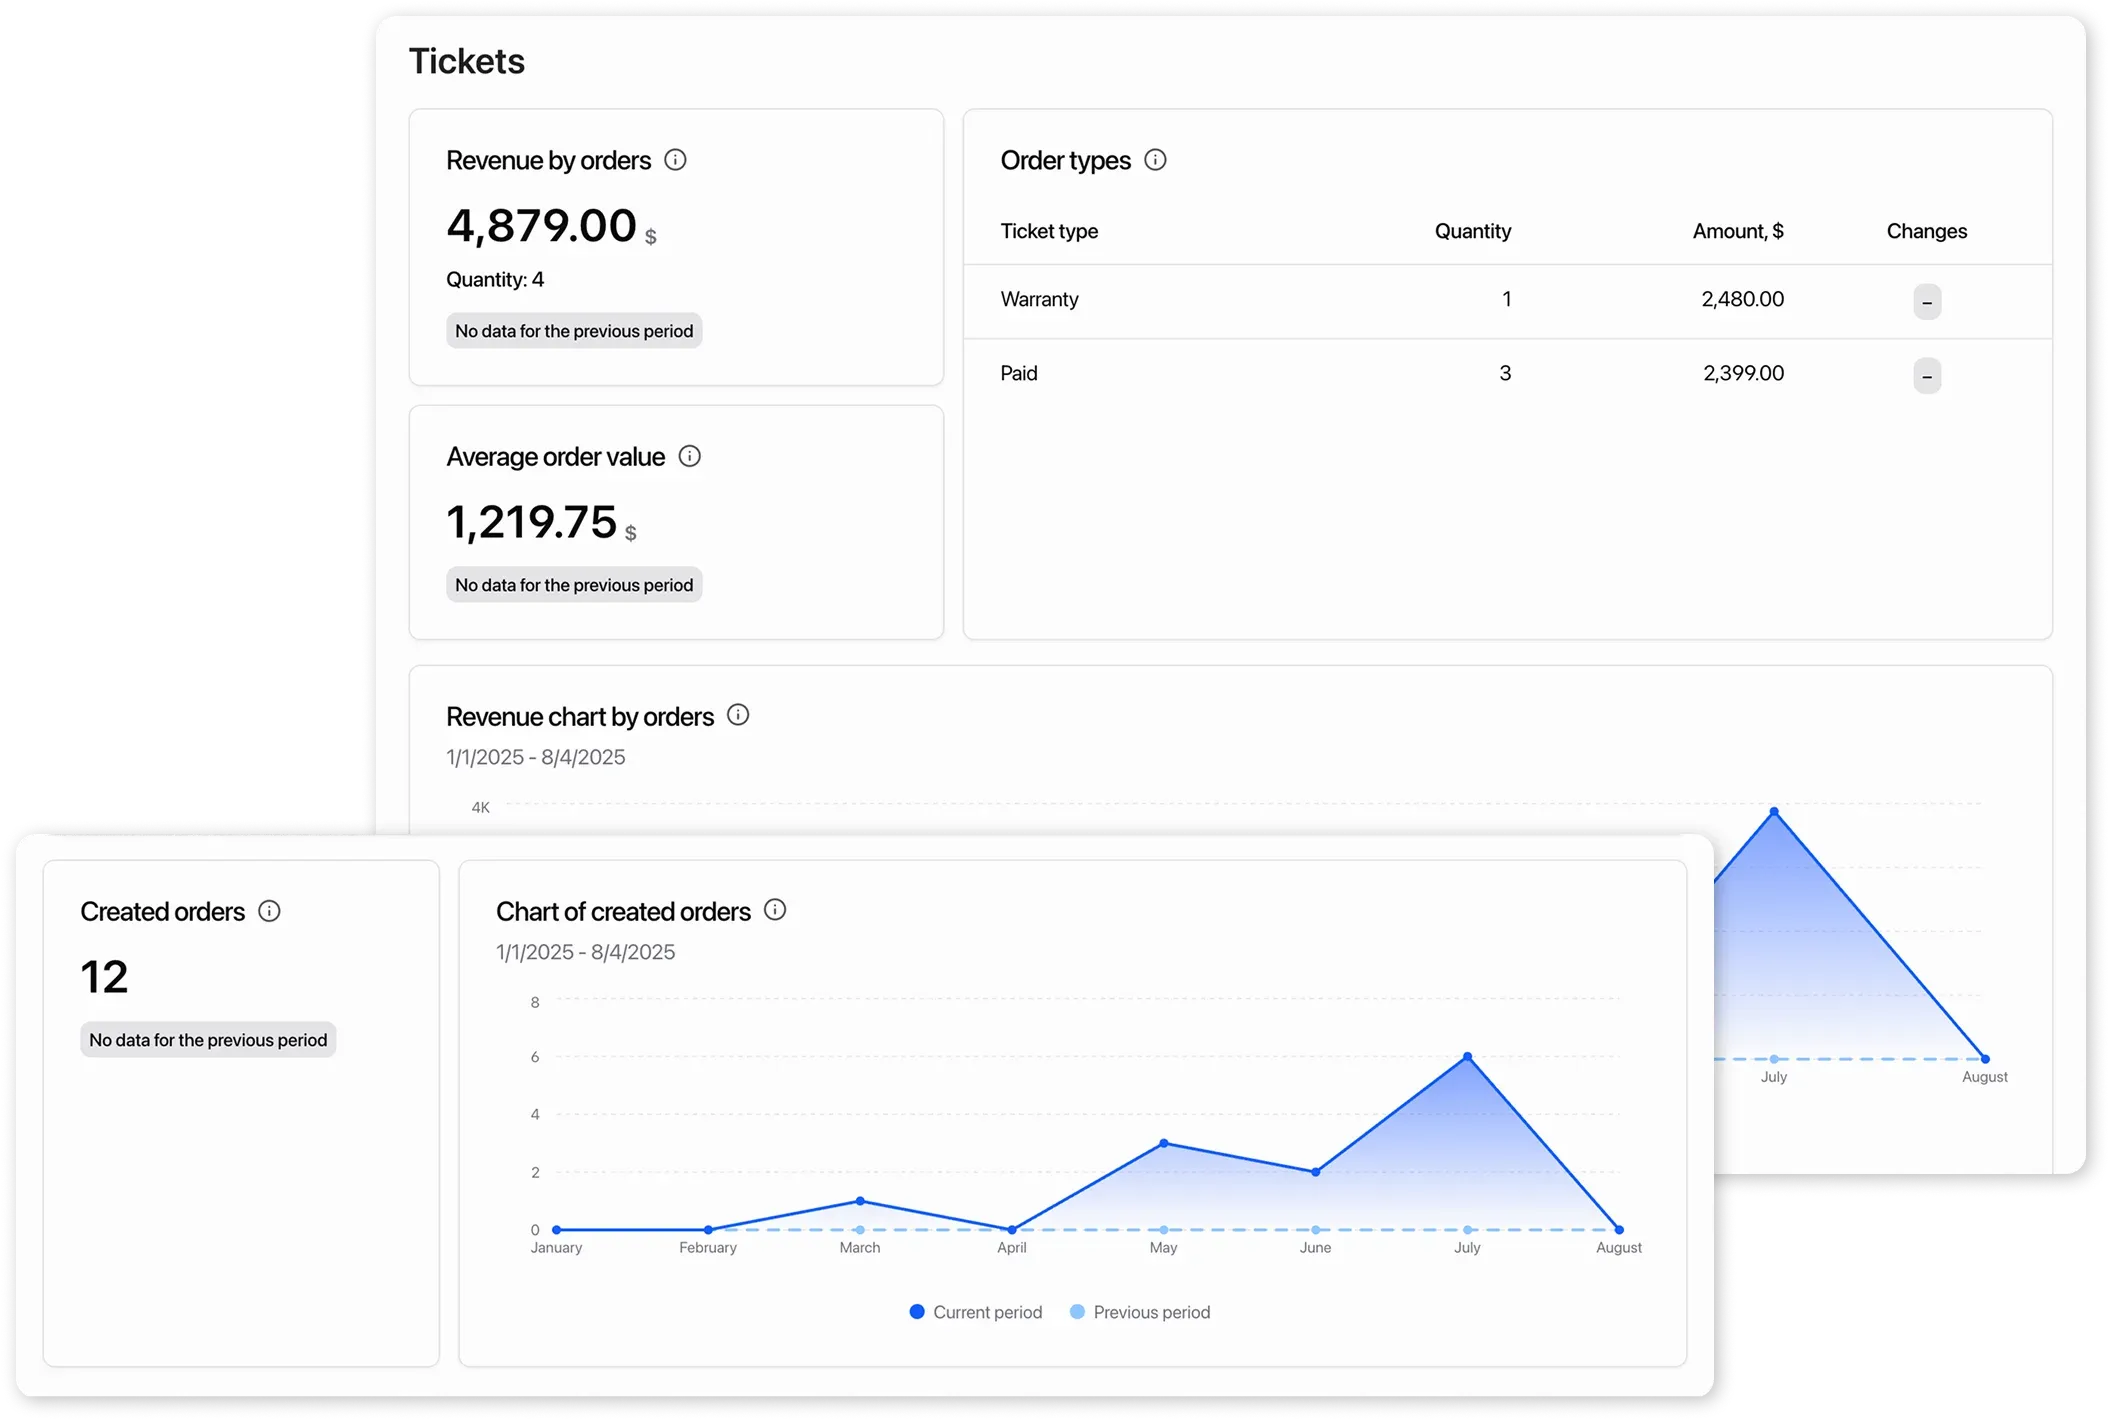
Section titled “Order Data”Revenue by orders
Section titled “Revenue by orders”how much money orders generated.
Order types
Section titled “Order types”shows how many orders of each type there were and how much revenue they brought.
Average order value
Section titled “Average order value”average revenue per order.
Revenue chart by orders
Section titled “Revenue chart by orders”shows how order revenue changed over time. Helps understand which days or weeks had higher or lower revenue from orders and compare with the previous period.
Created orders
Section titled “Created orders”shows the number of all orders created for the selected period compared to the previous period.
Chart of created orders
Section titled “Chart of created orders”shows when and how many orders were placed. Helps you see which days or weeks had more orders and which had fewer, and compare with the previous period.
Store Data
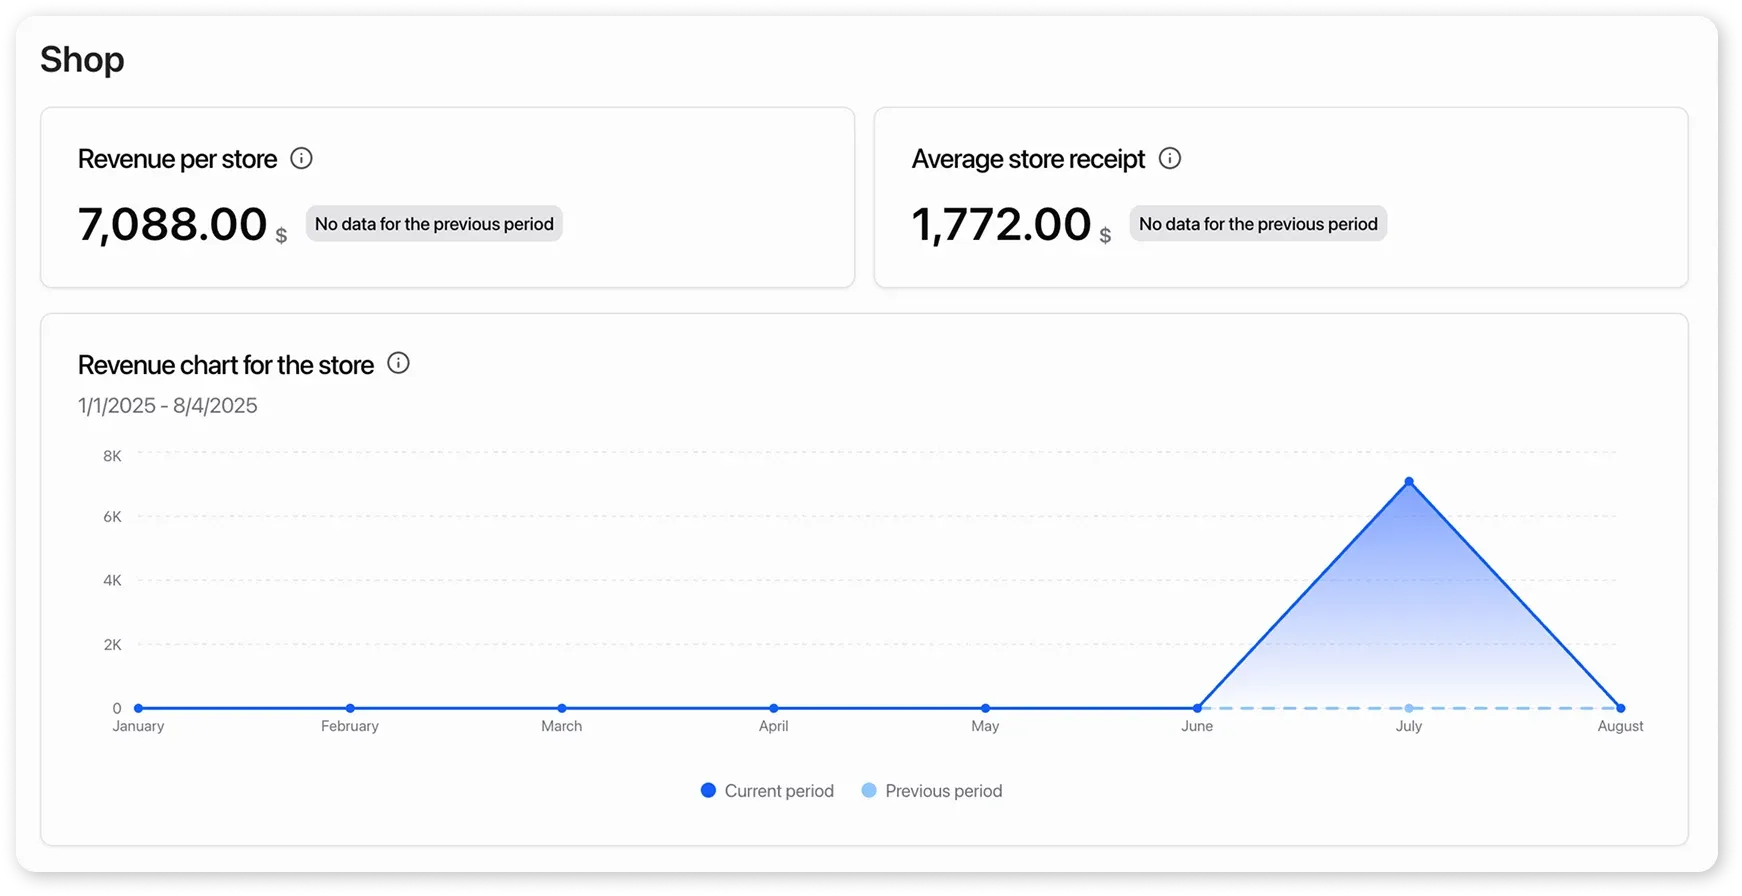
Section titled “Store Data”Revenue per store
Section titled “Revenue per store”total amount of products and services sold through the “Store” module.
Average store receipt
Section titled “Average store receipt”average purchase amount in the “Store”. Calculated only for paid sales.
Revenue chart for the store
Section titled “Revenue chart for the store”shows how revenue from sales through the “Store” module changed. Helps identify peaks and drops by day or week and compare with the previous period.
Current Period Data
Section titled “Current Period Data”Reflect metrics as of now, i.e., at the moment of viewing the report.
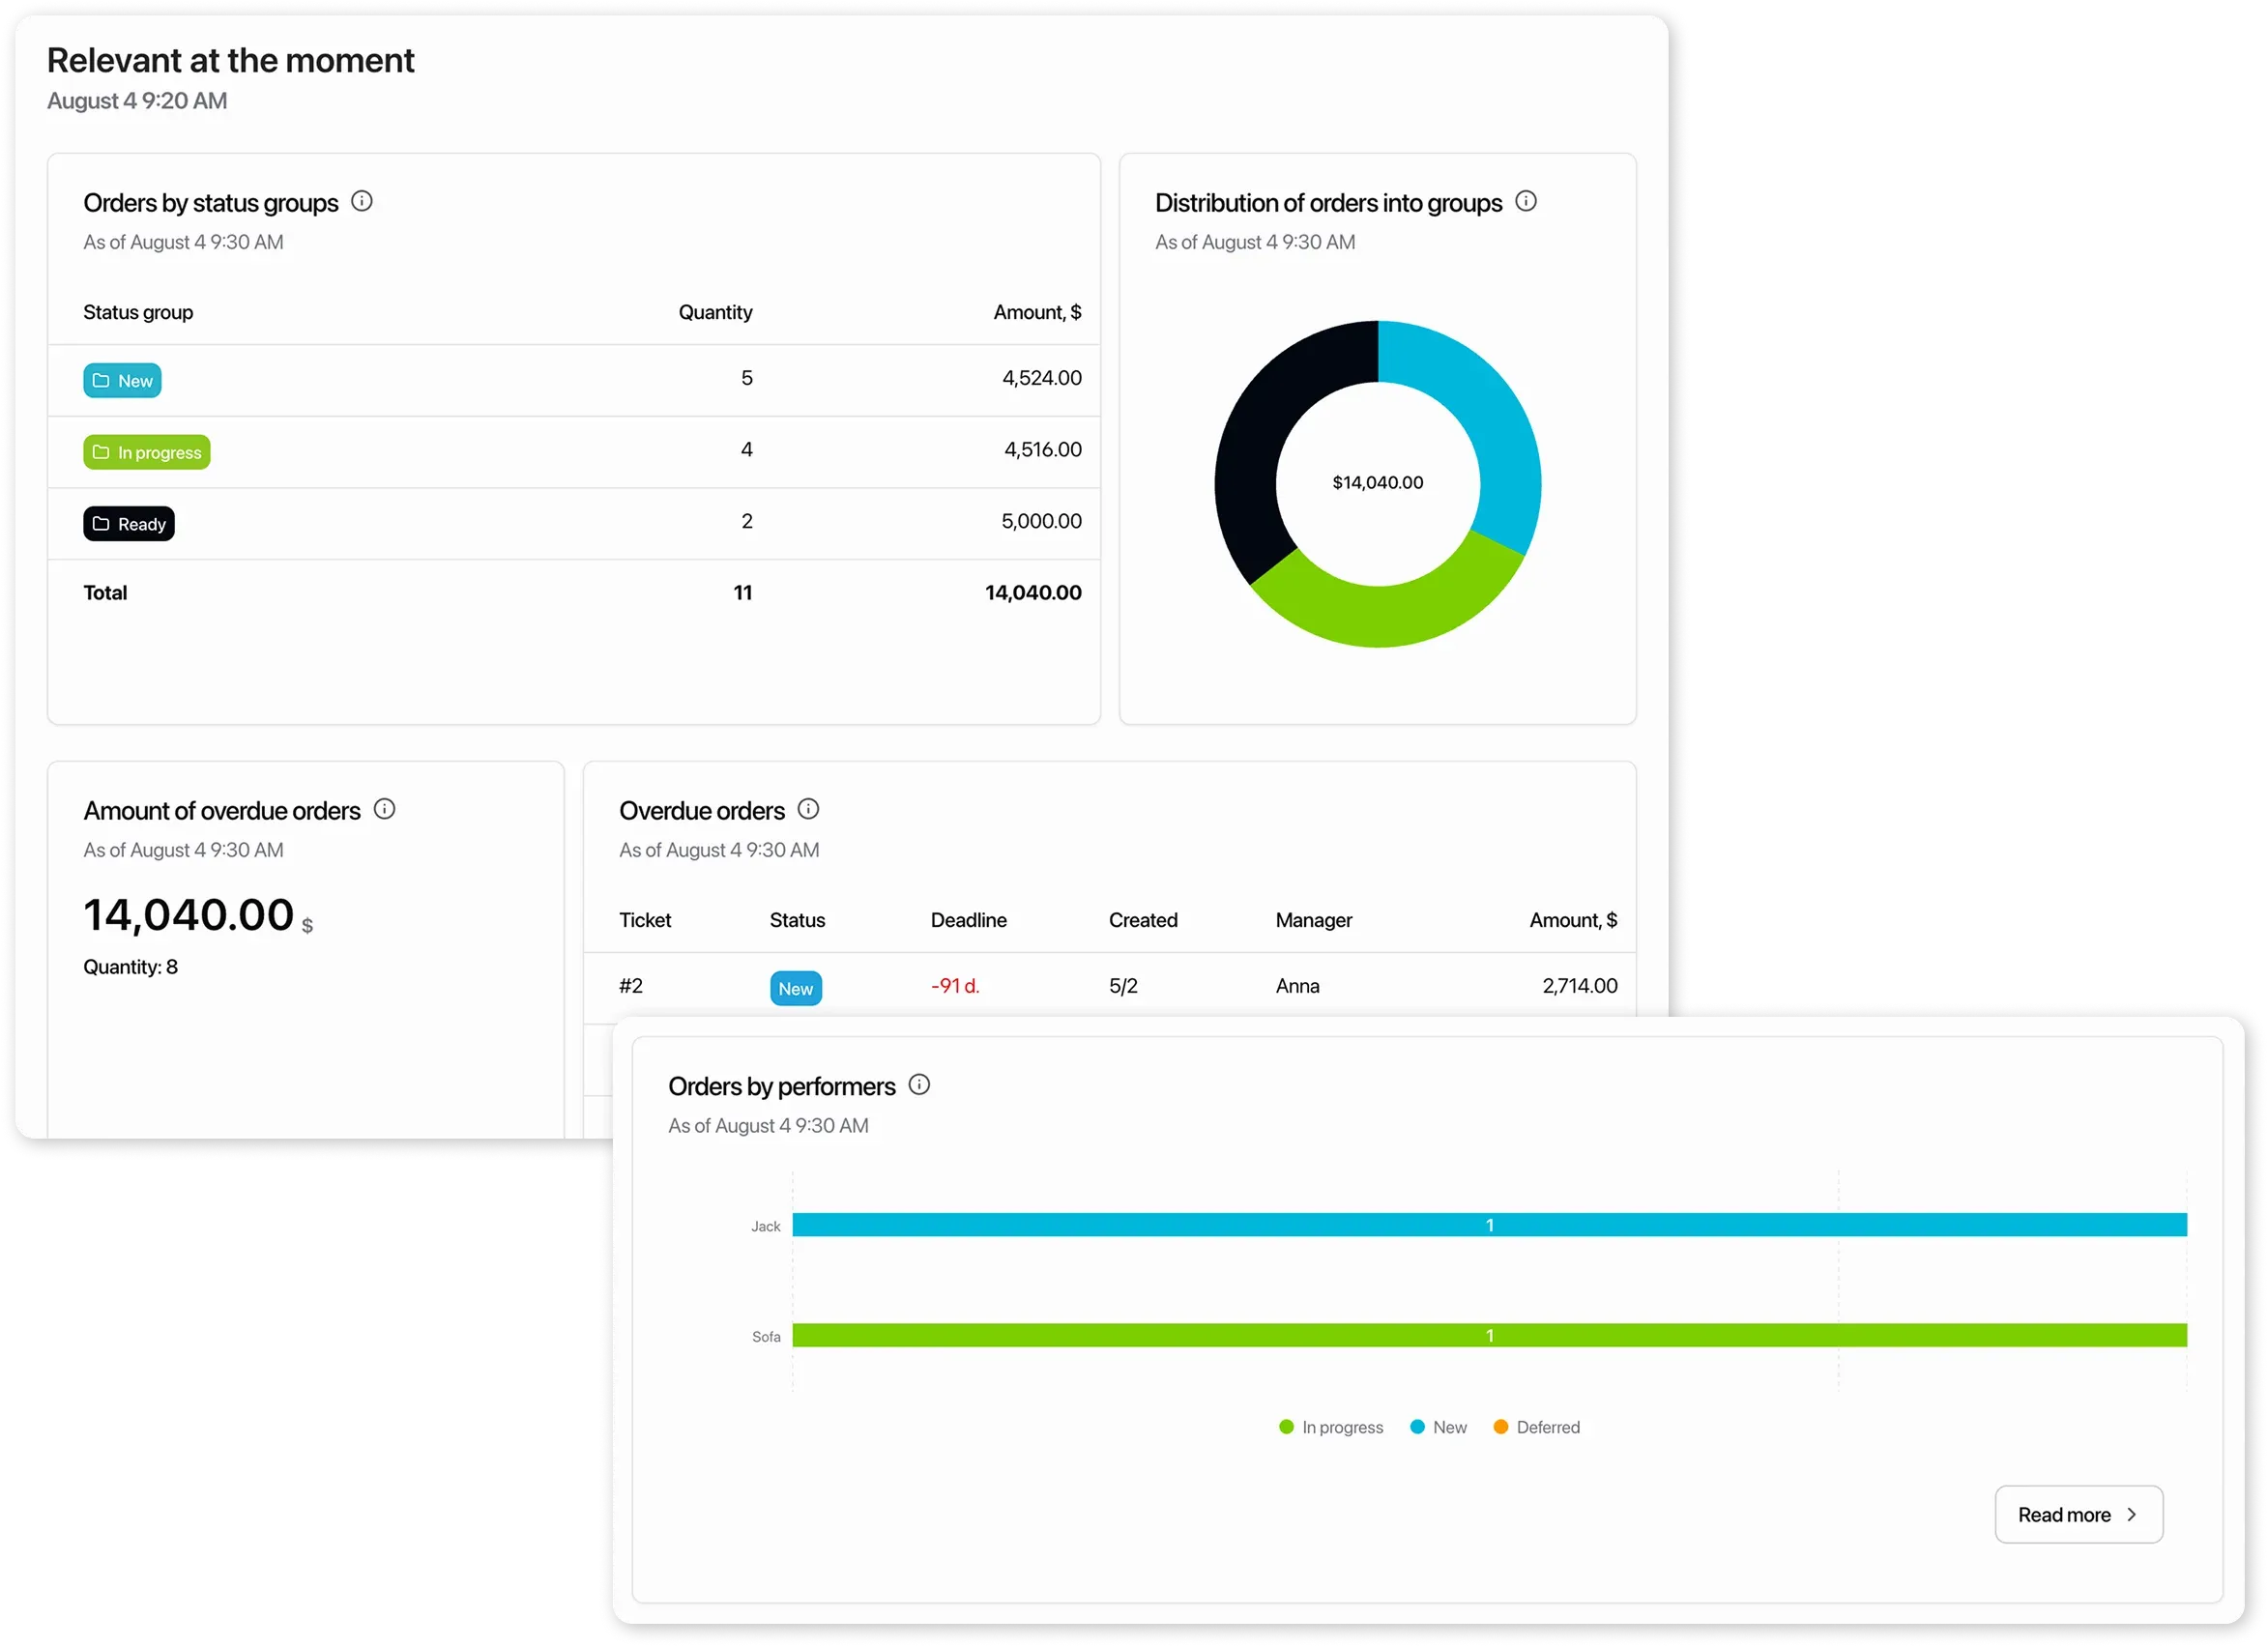
Orders by status groups
Section titled “Orders by status groups”shows how many orders are currently in progress and at which stages they are. Allows assessing expected revenue from active orders.
Distribution of orders by groups
Section titled “Distribution of orders by groups”shows how the total amount of active orders is distributed across work stages. Complements the table by status groups and helps visually assess where the main portion of expected revenue is.
Amount of overdue orders
Section titled “Amount of overdue orders”total sum and number of orders that were not completed on time.
Overdue orders
Section titled “Overdue orders”list of orders that were not completed on time.
Orders by performers
Section titled “Orders by performers”shows how many orders are currently assigned to each performer.